Facebook Ads
Facebook Ads Metrics - 15 Key Metrics You Should Track

Category: Facebook Ads
Facebook Ads Metrics: 15 Key Metrics You Should Track
Running Facebook Ads without monitoring the right numbers can quickly turn into guesswork.
You might see hundreds or thousands of clicks inside Meta Ads Manager and assume the campaign is performing well. But clicks alone don't tell you whether those visitors are becoming leads, customers, or revenue.
That's why understanding Facebook Ads metrics is so important.
The right metrics help you answer practical questions:
- Are people responding to the ads?
- Is the audience too expensive to reach?
- Are users clicking but failing to convert?
- Are your ads generating quality leads?
- Is your campaign actually making money?
- Is your audience becoming tired of seeing the same creative?
Whether you're running Facebook Ads for lead generation, ecommerce, local services, SaaS, or another business model, you don't need to monitor every number in Ads Manager every day.
You need to know which metrics matter and what each one is telling you.
In this guide, we'll look at 15 key Facebook Ads metrics you should track and explain when each metric becomes useful.
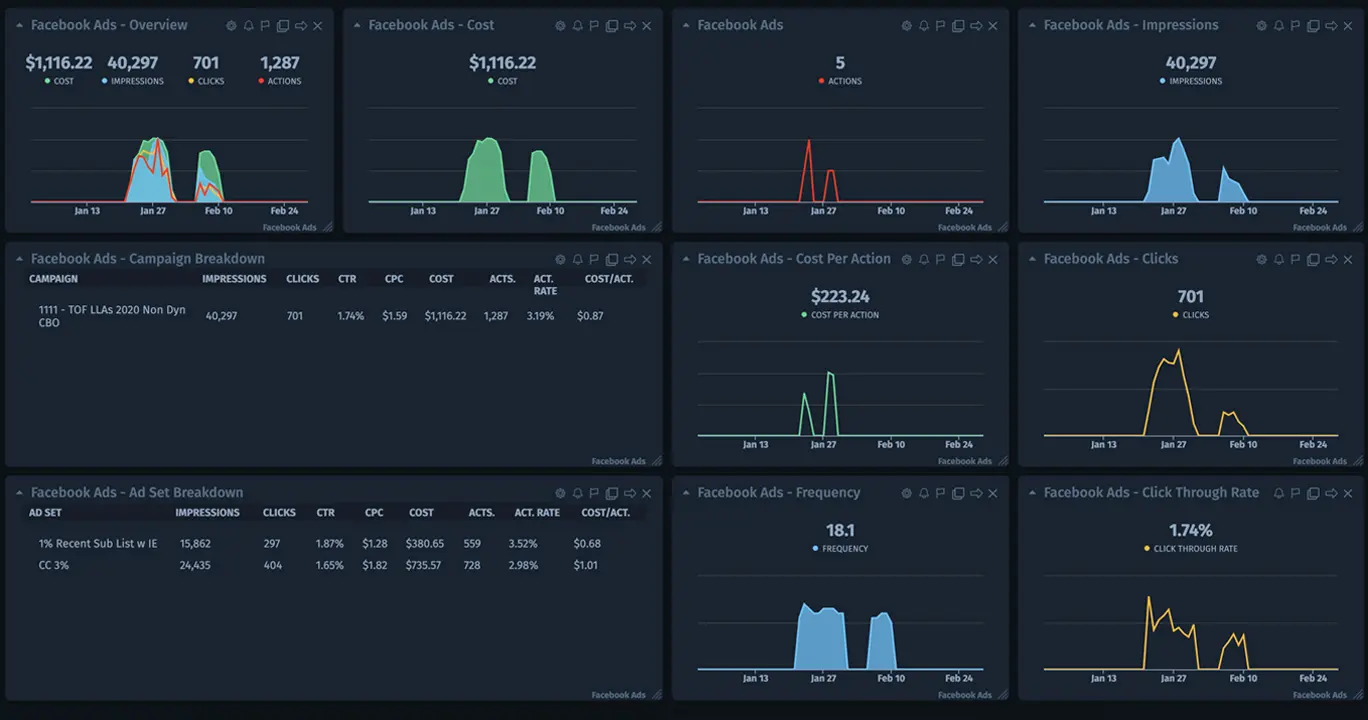
1. Amount Spent
Amount Spent is one of the simplest Facebook Ads metrics, but it provides important context for everything else.
It tells you how much your campaign, ad set, or ad has actually spent during the selected period.
For example, if a campaign has generated 20 leads at ₹500 per lead, the result looks very different from a campaign that generated the same 20 leads after spending ₹50,000.
Always look at performance metrics alongside spend.
For lead generation, you might compare:
Spend → Leads → Cost Per Lead → Qualified Leads → Customers → Revenue
For ecommerce:
Spend → Purchases → Purchase Value → ROAS → Profitability
This prevents you from focusing on surface-level metrics without considering the actual business outcome.
2. Impressions
Impressions represent the number of times your advertisement was displayed.
One person can generate multiple impressions, so impressions are not the same as the number of people who saw your ad.
For example, if 10,000 people each see an advertisement twice, you could have approximately 20,000 impressions.
Impressions become especially useful when analyzed together with reach and frequency.
A campaign with lots of impressions but very few clicks may indicate that the creative, offer, audience, or messaging needs attention.
However, don't automatically assume that low CTR means the campaign is failing. For some campaigns, the objective may be awareness rather than direct conversions.
3. Reach
Reach is the number of people who saw your advertisement at least once.
This is different from impressions.
If your campaign has:
- 100,000 impressions
- 40,000 people reached
then some users saw the advertisement more than once.
Reach is particularly useful when evaluating awareness campaigns and understanding audience saturation.
For conversion campaigns, reach becomes more meaningful when combined with frequency, CTR, conversions, and cost per result.
4. Frequency
Frequency tells you the average number of times each person in your audience saw your ad.
A simplified calculation is:
Frequency = Impressions ÷ Reach
For example:
100,000 impressions ÷ 25,000 people reached = 4 frequency.
A high frequency isn't automatically bad.
If you're running a retargeting campaign, showing an advertisement multiple times to someone who has already visited your website can be completely normal.
The problem appears when frequency keeps increasing while performance deteriorates.
You may notice:
- CTR declining
- CPC increasing
- Conversions decreasing
- CPA increasing
- Negative feedback increasing
This can indicate ad fatigue or audience saturation.
If this happens, test new creatives, messaging, offers, or audience segments.
Our guide on best retargeting audiences in Meta Ads explains how different audience segments can be used throughout the customer journey.
5. CPM — Cost Per 1,000 Impressions
CPM (Cost Per Mille) tells you how much it costs to generate 1,000 impressions.
The basic formula is:
CPM = (Amount Spent ÷ Impressions) × 1,000
Suppose you spend ₹5,000 and receive 100,000 impressions.
Your CPM would be:
₹50
CPM can vary considerably depending on:
- Audience
- Location
- Industry
- Competition
- Seasonality
- Placement
- Campaign objective
- Creative quality
A high CPM doesn't automatically mean your campaign is poorly managed.
For example, a highly competitive audience may naturally cost more to reach.
Instead of optimizing CPM in isolation, compare it with CTR and conversion performance.
6. Link Clicks
Link Clicks show how many times people clicked a link in your advertisement.
This can help you understand whether your advertisement is generating traffic.
However, link clicks shouldn't be treated as the final goal unless traffic itself is your campaign objective.
A campaign can generate thousands of clicks and still produce very few leads or sales.
That's why link clicks should be evaluated alongside:
- CTR
- CPC
- Landing Page Views
- Conversion Rate
- Cost Per Lead
- Cost Per Purchase
- ROAS
Traffic is useful only when it moves users closer to a meaningful business outcome.
7. CTR — Click-Through Rate
CTR (Click-Through Rate) is one of the most commonly monitored Facebook Ads metrics.
It measures how frequently people click after seeing your advertisement.
A simplified formula is:
CTR = Clicks ÷ Impressions × 100
For example, 1,000 clicks from 100,000 impressions gives a 1% CTR.
CTR can provide insight into how well your creative and message are attracting attention.
If impressions are high but CTR is consistently low, consider testing:
- New hooks
- Different images
- Shorter copy
- Different headlines
- Stronger offers
- Different calls to action
- New creative formats
Don't chase a high CTR simply for the sake of having a high CTR.
An advertisement can have an excellent CTR but generate poor-quality leads.
The ultimate goal is to connect engagement with meaningful business results.
8. CPC — Cost Per Click
CPC (Cost Per Click) tells you how much you're paying, on average, for each click.
A basic calculation is:
CPC = Amount Spent ÷ Clicks
For example, spending ₹2,000 to generate 500 clicks gives you a CPC of ₹4.
CPC is useful for understanding traffic efficiency.
However, a cheap click isn't necessarily a valuable click.
Imagine:
Campaign A: ₹5 CPC and 10% conversion rate
Campaign B: ₹2 CPC and 1% conversion rate
Campaign B has cheaper clicks, but Campaign A may generate considerably more business.
This is why CPC should always be connected to conversion metrics.
9. Landing Page Views
A Landing Page View occurs when someone clicks your advertisement and successfully loads the destination page.
This metric is particularly useful because not every link click necessarily results in a meaningful website visit.
Someone might click the ad and immediately leave before the page loads.
Comparing link clicks with landing page views can help identify potential issues with:
- Page speed
- Mobile experience
- Redirects
- Website loading
- Tracking implementation
If you have a large gap between link clicks and landing page views, investigate what happens after the click.
10. Engagement Rate
Engagement includes interactions such as reactions, comments, shares, saves, and other forms of interaction depending on the placement and reporting setup.
Engagement can tell you whether people are actively responding to your content.
It's especially useful for campaigns designed around:
- Brand awareness
- Content promotion
- Social engagement
- Community building
- Video content
However, engagement isn't always a direct indicator of sales.
A funny advertisement might receive thousands of reactions but generate very few customers.
For performance campaigns, use engagement as a supporting metric rather than the only measure of success.
11. Conversion Rate
Conversion Rate tells you what percentage of visitors or clicks completed the desired action.
For example:
Conversions ÷ Website Visitors × 100
If 1,000 people visit your landing page and 50 submit a form, your conversion rate is 5%.
This metric is extremely useful for identifying where the problem exists.
Suppose your Facebook campaign generates:
- High impressions
- Good CTR
- Low CPC
- Plenty of landing page visits
- Very few leads
The problem may not be your Facebook advertising.
The issue could be the landing page, offer, form, pricing, trust signals, or conversion tracking.
This is why Facebook Ads optimization shouldn't stop inside Ads Manager.
12. Cost Per Lead (CPL)
For lead generation campaigns, Cost Per Lead (CPL) is one of the most important metrics.
The calculation is:
CPL = Amount Spent ÷ Leads Generated
For example:
₹10,000 spend ÷ 50 leads = ₹200 CPL.
But don't stop there.
A ₹200 lead isn't necessarily better than a ₹500 lead.
If the ₹200 leads are poor quality while the ₹500 leads regularly become customers, the more expensive leads could produce better business results.
Track:
CPL → Qualified Leads → Sales → Revenue
This gives you a much clearer picture of lead-generation performance.
For more practical strategies, see our guide on how to lower cost per lead with Meta Ads.
13. Cost Per Acquisition (CPA)
CPA (Cost Per Acquisition) measures how much it costs to generate a desired acquisition, such as a customer.
The exact definition of an acquisition depends on your campaign.
For an ecommerce company, it may mean a purchase.
For a SaaS company, it could mean a paid signup.
For a service business, it might mean a closed customer.
For example:
₹50,000 ad spend ÷ 100 customers = ₹500 CPA.
CPA is generally more useful than simply looking at clicks because it connects advertising spend with an actual outcome.
If your CPA is increasing, investigate the complete funnel instead of immediately changing the audience.
Look at:
CPM → CTR → CPC → Landing Page → Conversion Rate → CPA
This sequence can help identify where performance is breaking down.
14. ROAS — Return on Ad Spend
ROAS (Return on Ad Spend) is one of the most important metrics for ecommerce and revenue-focused campaigns.
The formula is:
ROAS = Revenue Attributed to Ads ÷ Advertising Spend
For example:
₹100,000 revenue ÷ ₹20,000 ad spend = 5X ROAS
This means the campaign generated ₹5 in attributed revenue for every ₹1 spent on advertising.
ROAS should be interpreted within the context of your margins and business costs.
A 5X ROAS isn't automatically profitable if product margins, shipping, returns, discounts, salaries, and other expenses consume most of the revenue.
Similarly, a lower ROAS could still be acceptable for a business with strong margins or high customer lifetime value.
For ecommerce campaigns, also monitor purchase value, average order value, repeat purchases, and profitability.
Our Meta Ads ecommerce scaling strategy covers additional metrics worth watching as campaigns grow.
15. Conversion Value
Conversion Value represents the monetary value assigned to conversions generated through your campaigns.
For ecommerce, this can usually correspond to purchase revenue.
For lead generation, businesses may assign values to different types of leads.
For example:
- Basic lead = ₹500
- Qualified lead = ₹2,000
- Sales opportunity = ₹10,000
The exact approach depends on your business and how reliably you can assign values.
Conversion value becomes particularly useful when comparing campaigns that generate different numbers of conversions with different values.
A campaign producing 100 low-value conversions isn't necessarily more valuable than a campaign producing 30 high-value conversions.
When reliable revenue data is available, optimize toward business value rather than conversion volume alone.
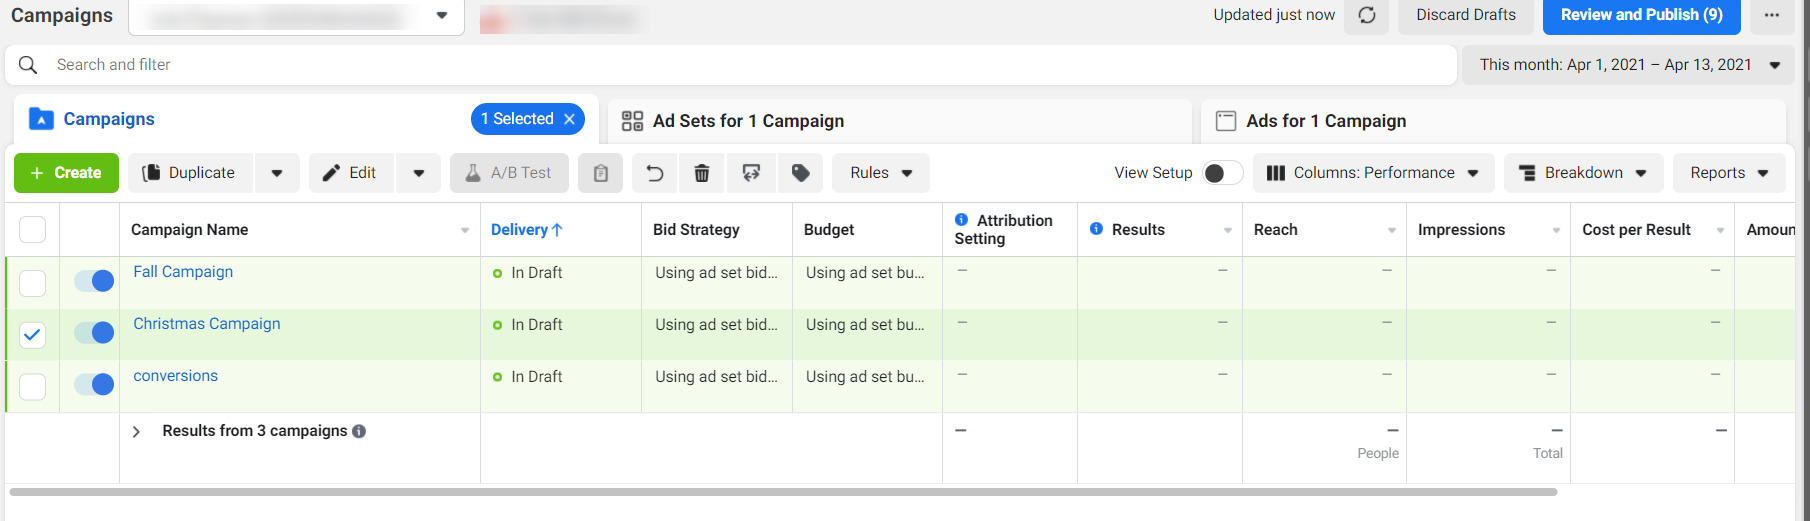
Which Facebook Ads Metrics Should You Prioritize?
You don't need to stare at all 15 metrics every morning.
The metrics you prioritize should depend on your campaign objective.
For Lead Generation
Focus primarily on:
- Cost Per Lead
- Qualified Lead Rate
- Conversion Rate
- CPA
- CTR
- CPC
- Landing Page Views
For Ecommerce
Focus primarily on:
- ROAS
- Purchase Value
- Cost Per Purchase
- CPA
- Conversion Rate
- Average Order Value
- CTR
For Awareness Campaigns
Focus more on:
- Reach
- Impressions
- Frequency
- CPM
- Video engagement
- Engagement rate
The key is to connect advertising metrics with actual business goals.
Don't Optimize Facebook Ads Using One Metric
One of the most common mistakes advertisers make is trying to improve one metric without looking at the rest of the funnel.
For example:
Low CPC sounds good.
But what if those cheap clicks don't convert?
High CTR sounds good.
But what if the campaign produces poor-quality leads?
Low CPL sounds good.
But what if sales teams can't close those leads?
Instead, look at the complete path:
Ad → Click → Landing Page → Conversion → Qualified Lead → Customer → Revenue
This approach gives you much better information about where optimization is actually needed.
If your campaign structure needs work, our Facebook Ads campaign structure guide can help you organize campaigns, ad sets, audiences, budgets, and creatives more effectively.
Accurate Tracking Comes Before Optimization
You can't make reliable decisions from unreliable data.
Before optimizing Facebook Ads based on conversions, make sure your tracking setup is working correctly.
This can include:
- Meta Pixel
- Conversion API
- Google Tag Manager
- Google Analytics 4
- Proper event configuration
- Deduplication
- Conversion value tracking
Our Meta Pixel setup guide explains the fundamentals of setting up website event tracking.
For more advanced implementations, see our Meta Conversion API guide.
If you are running advertising across multiple platforms, conversion tracking services can also help create a more consistent measurement system.
Final Thoughts
Facebook Ads metrics are useful because they show you what is happening at different stages of your advertising funnel.
CPM tells you what it costs to reach people.
CTR and CPC tell you how efficiently your ads generate traffic.
Landing Page Views and Conversion Rate help you understand what happens after the click.
CPL and CPA show how efficiently you're generating business outcomes.
And ROAS and Conversion Value connect advertising performance to revenue.
The biggest mistake is treating any single metric as the definition of success.
A successful Facebook Ads campaign isn't necessarily the one with the cheapest clicks or highest CTR.
It's the campaign where the advertising data connects with the business outcome you're trying to achieve.
If you want to improve your Facebook and Instagram advertising strategy, explore our Meta Ads Management Services or visit Scale With Clicks to learn more about our performance marketing services.
Frequently Asked Questions
What are the most important Facebook Ads metrics?
The most important metrics depend on your campaign objective. For lead generation, CPL, CPA, conversion rate, CTR, and qualified lead rate are important. For ecommerce, ROAS, purchase value, CPA, and conversion rate are especially useful.
What is a good CTR for Facebook Ads?
There isn't one universal CTR that applies to every Facebook Ads campaign. CTR varies by industry, audience, creative, placement, campaign objective, and offer. Compare your results against your own historical performance and conversion quality.
What is ROAS in Facebook Ads?
ROAS stands for Return on Ad Spend. It measures the revenue attributed to advertising compared with the amount spent. For example, ₹50,000 in attributed revenue from ₹10,000 in ad spend equals a 5X ROAS.
Should I focus on CPC or CPA?
If your objective is generating leads or customers, CPA is generally closer to the final business outcome than CPC. CPC is still useful for diagnosing traffic costs and understanding how efficiently your ads generate clicks.
Why is my Facebook Ads CTR good but my conversions are low?
A strong CTR means people are clicking, but it doesn't guarantee that they will convert. Check the landing page, offer, page speed, mobile experience, form, messaging, conversion tracking, and lead quality.
How often should I check Facebook Ads metrics?
You can monitor campaigns regularly, but avoid making major decisions based on very small amounts of data or a single day's performance. Look for meaningful trends and compare performance across an appropriate time period.
Which Facebook Ads metric is most important for ecommerce?
ROAS, purchase value, cost per purchase, CPA, conversion rate, and average order value are useful starting points. Ultimately, profitability and customer value should be considered alongside platform-reported metrics.
How can I improve Facebook Ads performance?
Start with accurate tracking, then review targeting, creative, offer, landing page, campaign structure, and conversion data. Avoid optimizing only for clicks. Focus on the metrics that connect directly with leads, customers, revenue, and profitability.